
13 Model evaluation
13.1 Goodness-of-fit
IQR Tools automatially generates the typical goodness-of-fit diagnostics when executing an NLME project using the run_IQRnlmeProject() function. In most cases the user will not need to handle that manually. These diagnostics are stored in the RESULTS folder of an IQRnlmeProject as PDF and table text files.
Here we show how user can generate specific plots in a manual way. In the following we will use one of the NLME projects generated in longitudinal NLME modeling as example model.
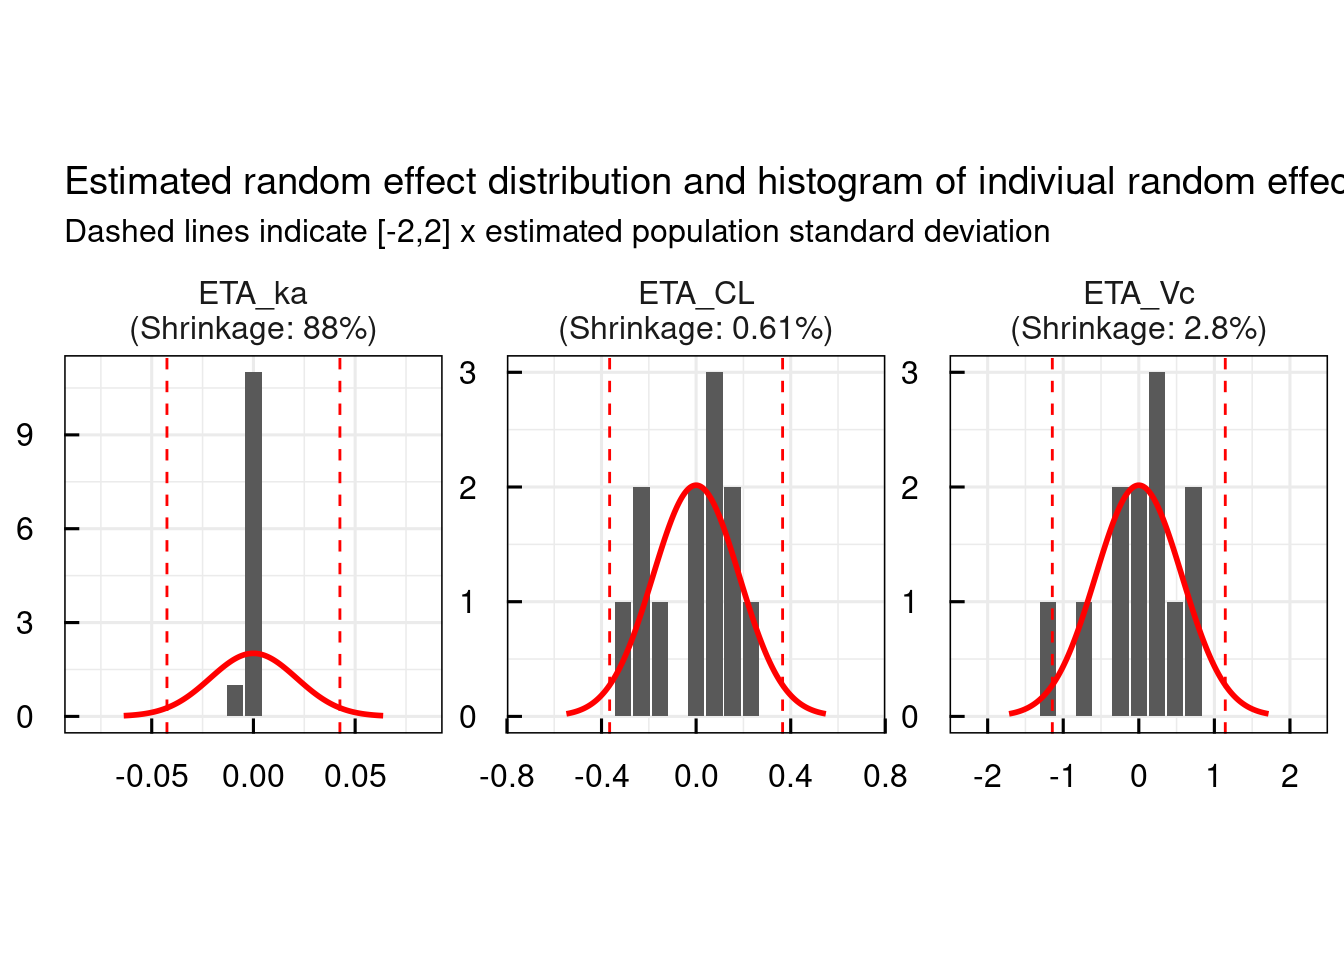
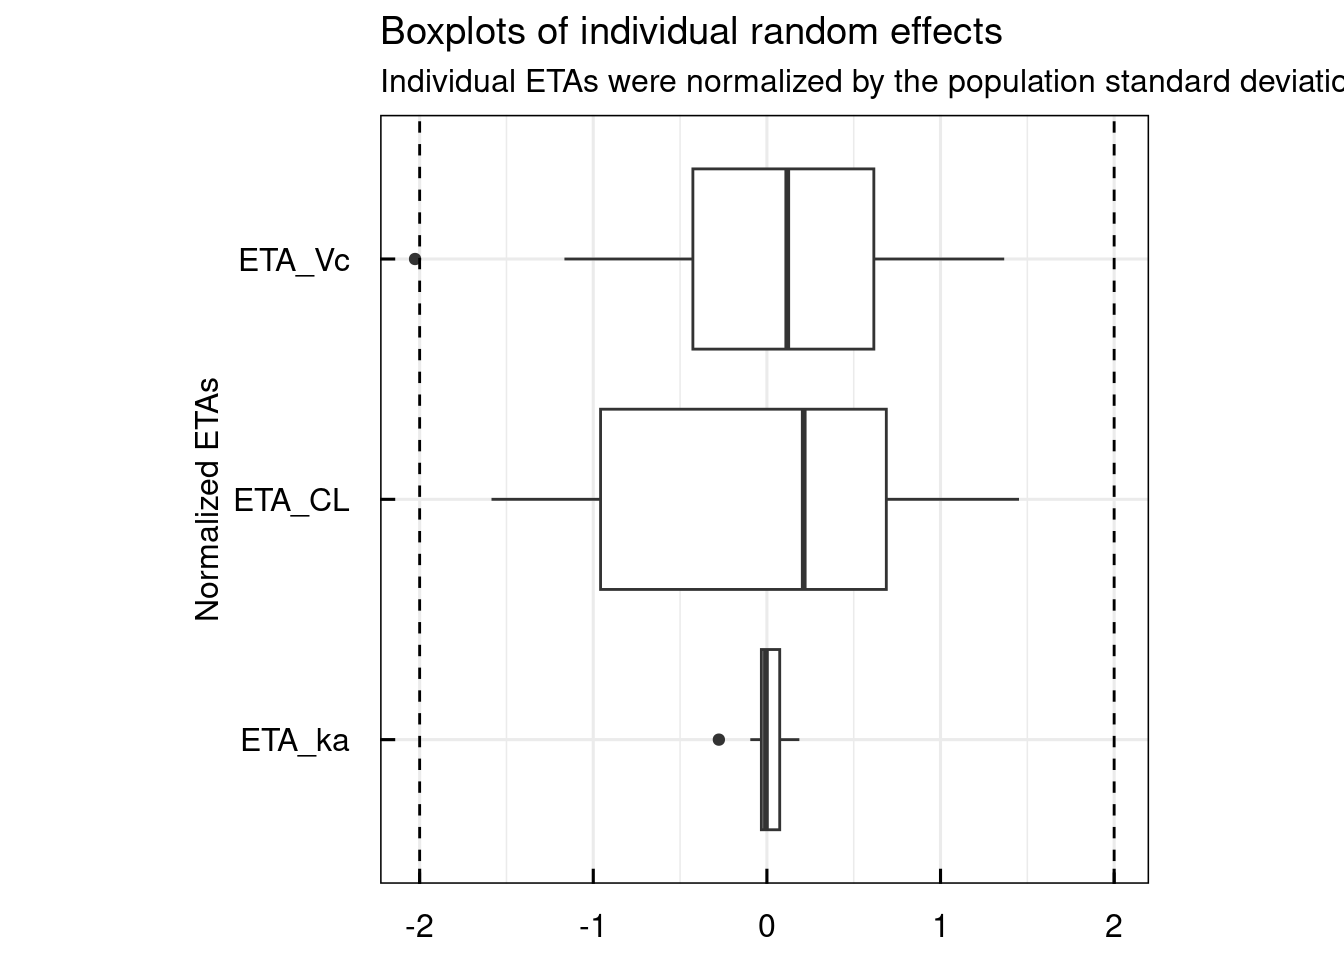
13.1.1 Random effects
Typical random effect diagnostics are generated with the plotETA_IQRnlmeProject() function.
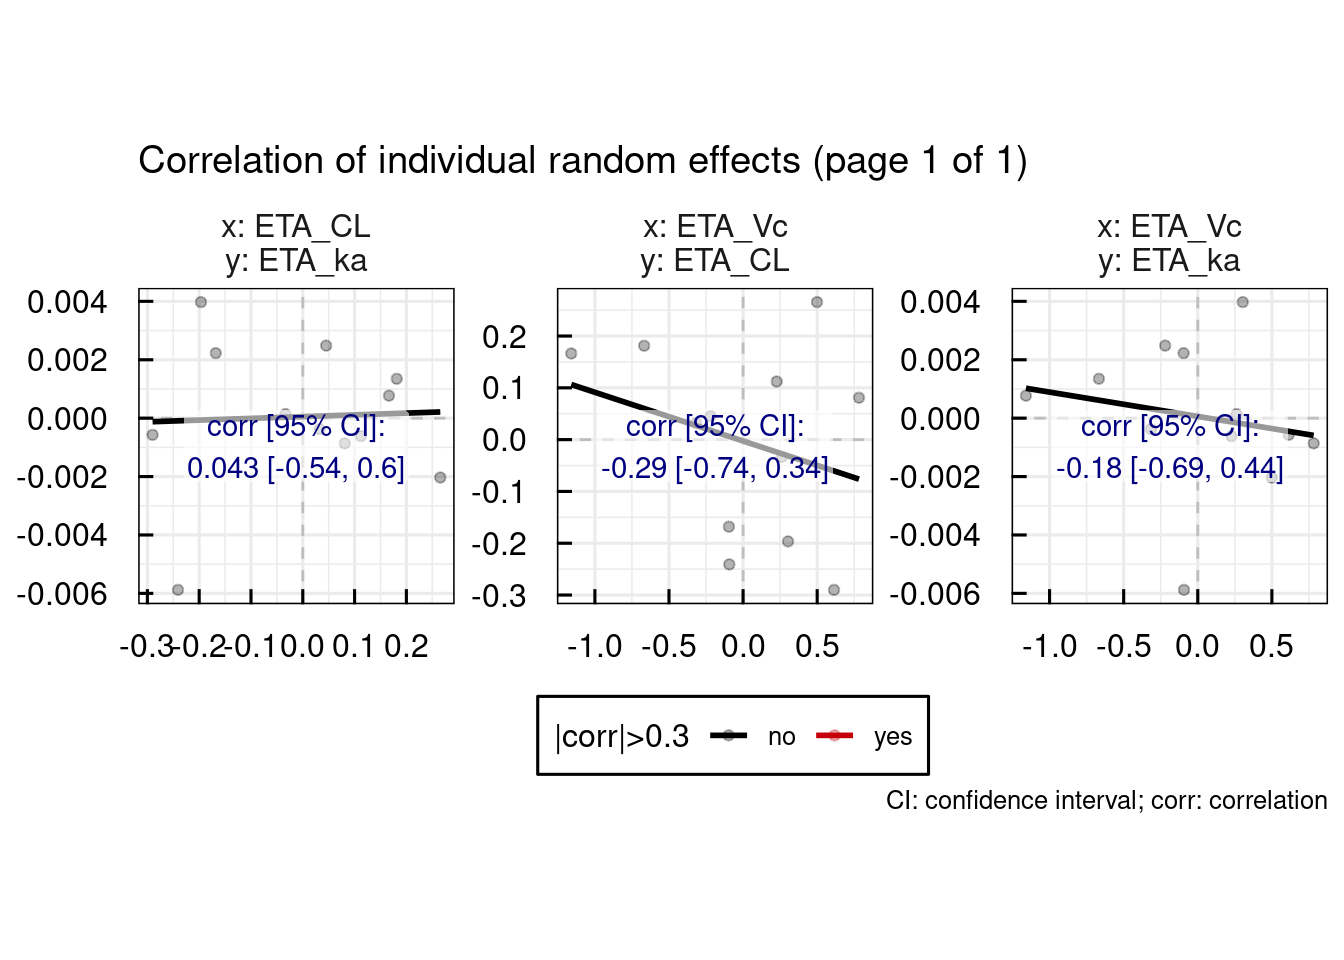
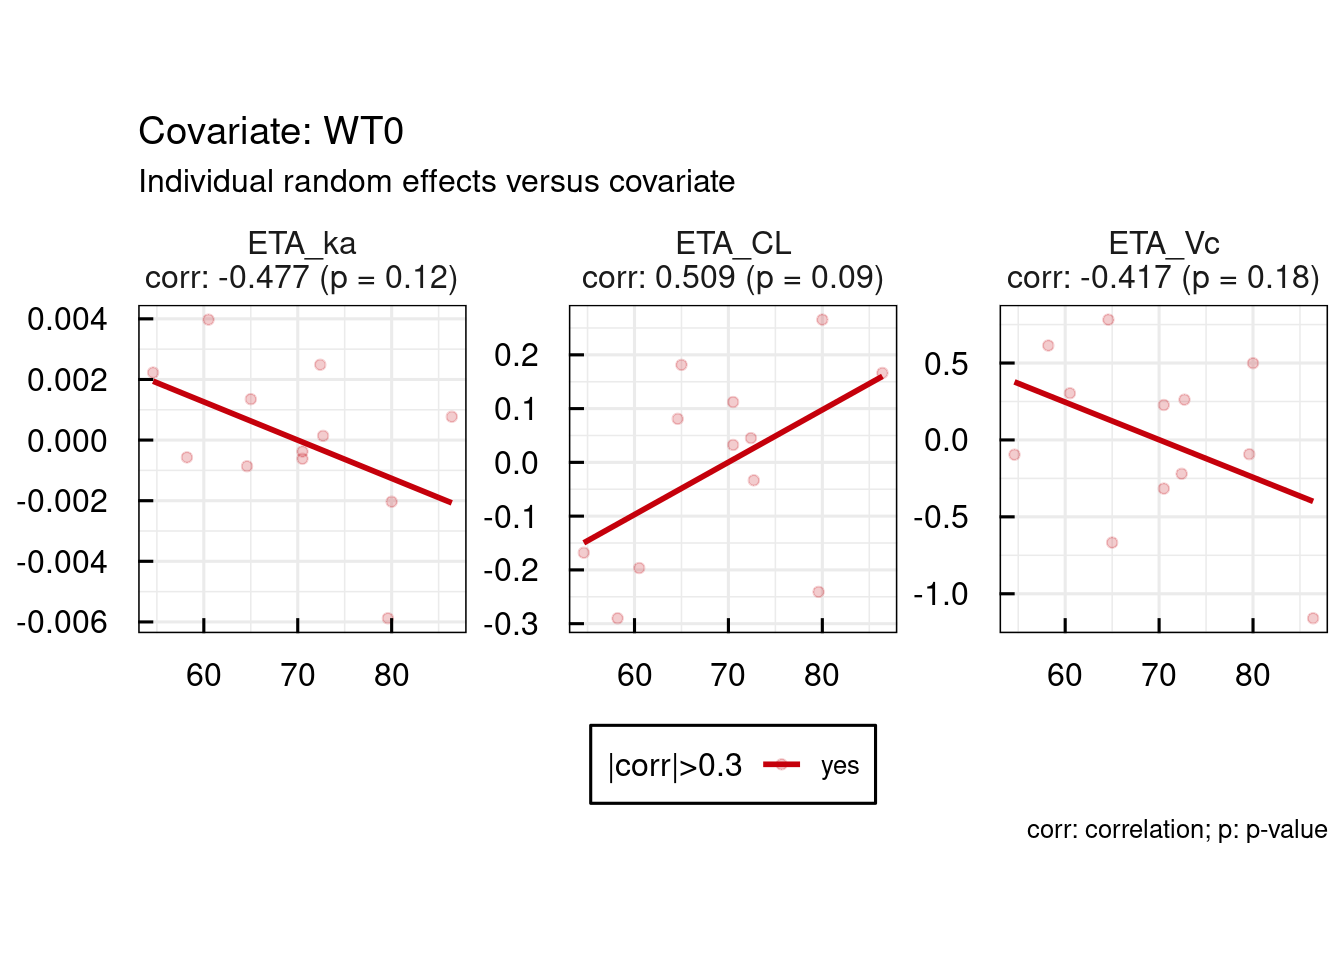
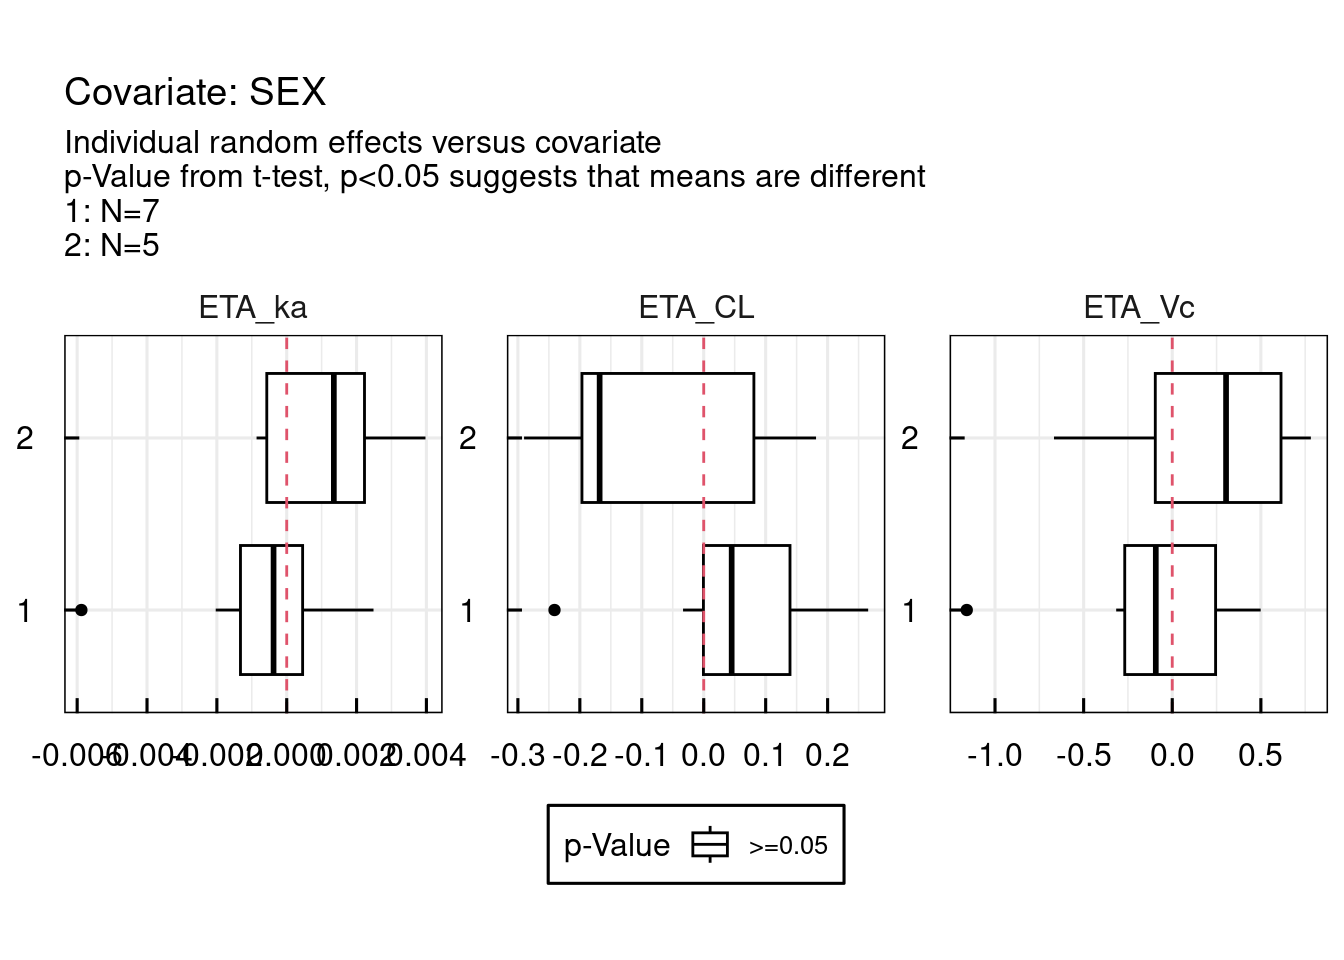
13.1.2 Random effects / covariates
Correlations between random effects and covariates are plotted as follows:
13.1.3 GOF plots
Typical DV/PRED, DV/IPRED, and residual plots are output specific plots. By default the following function will generate the plots for OUTPUT1 but the output number of interest can be provided as argument:
The output argument from the previous function call is list of ggplot object. Here we simply plot all of them:
## $`DV vs. I/PRED linear`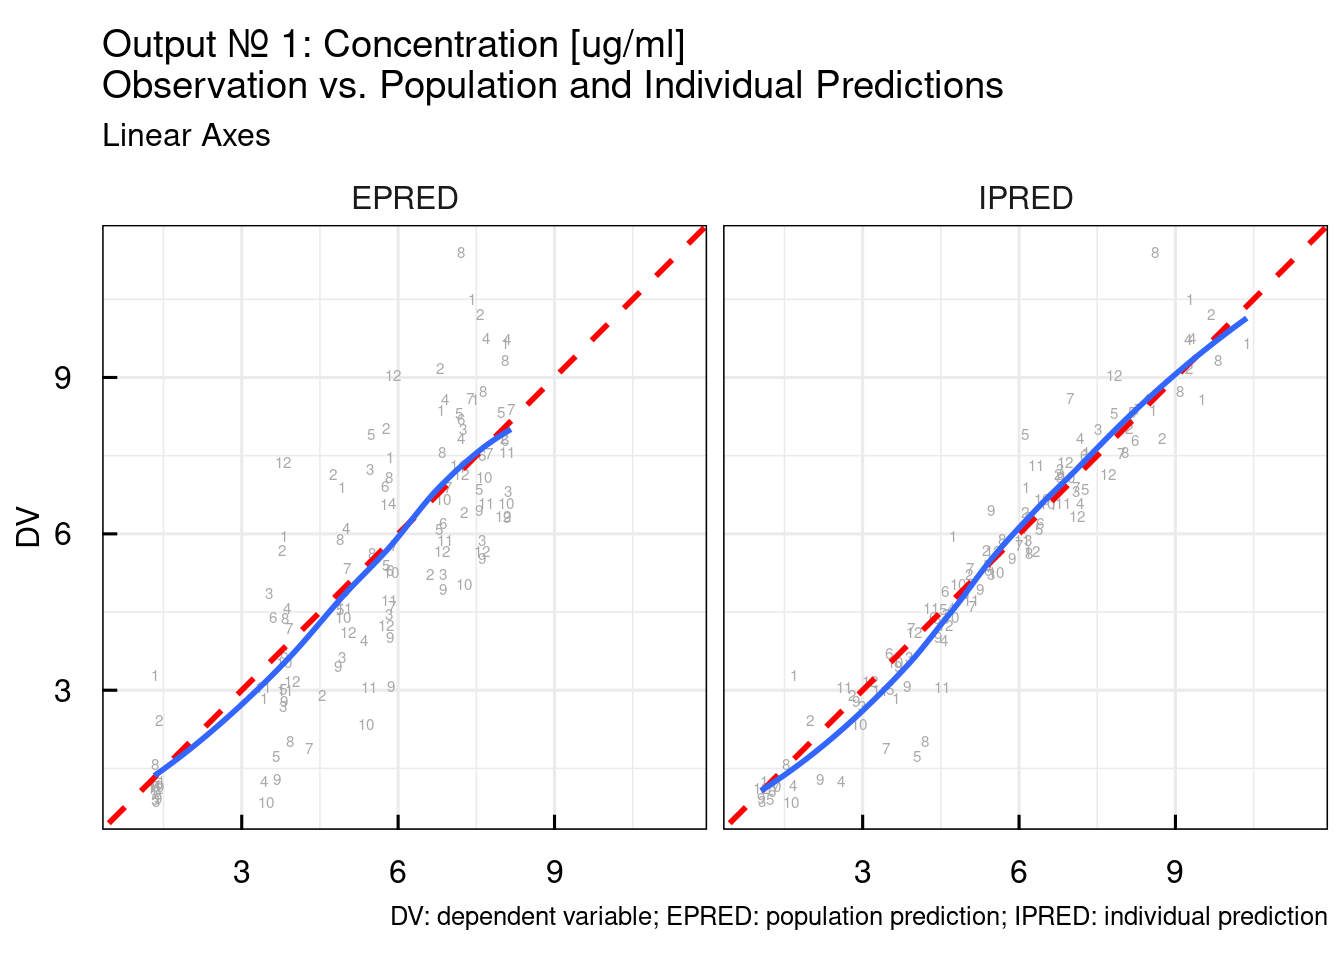
##
## $`DV vs. I/PRED log10`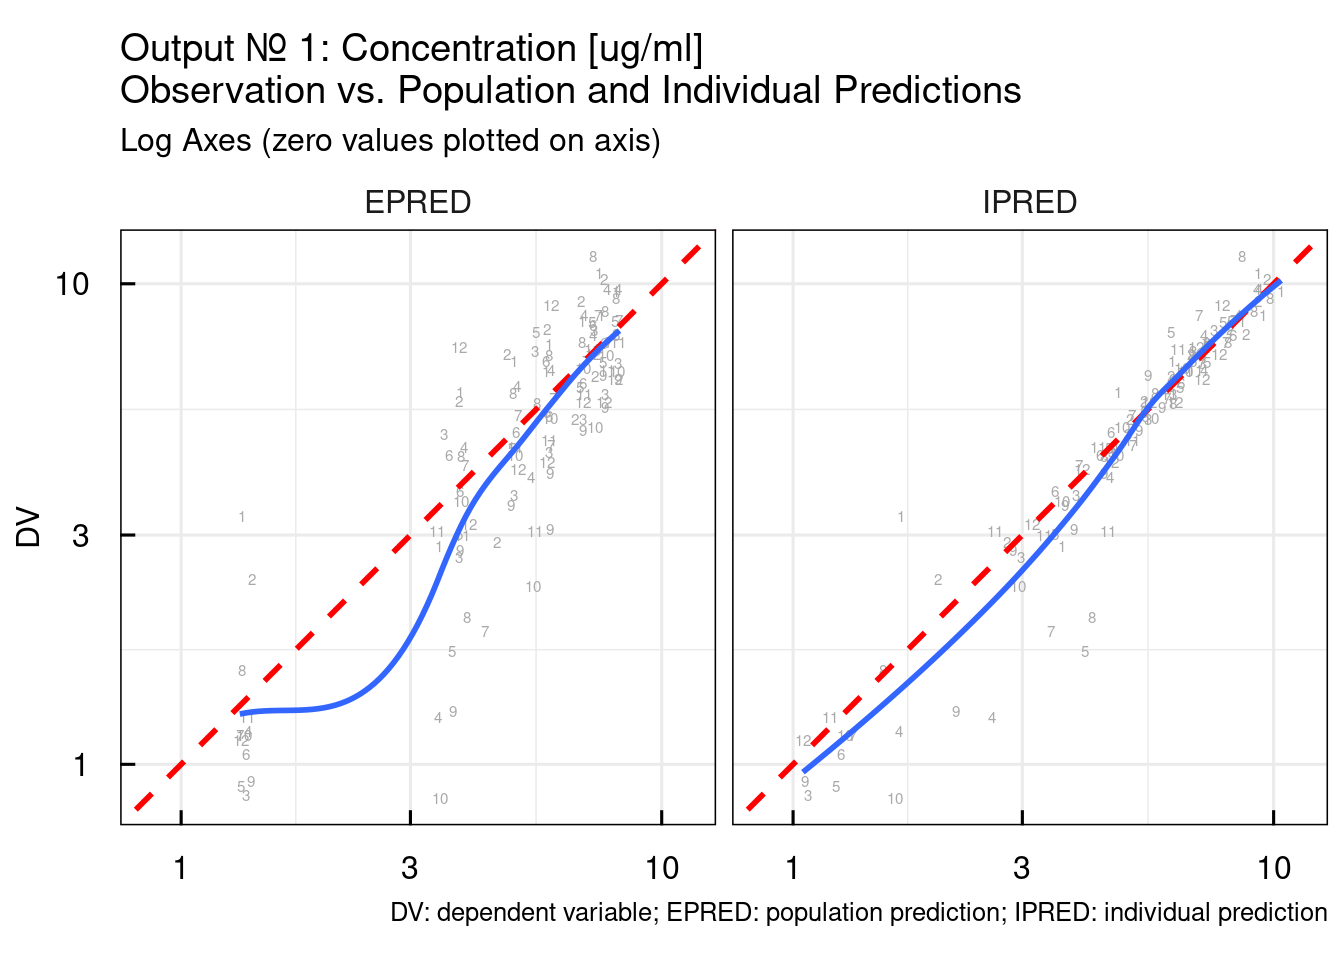
##
## $`RES/NPDE vs TIME linear`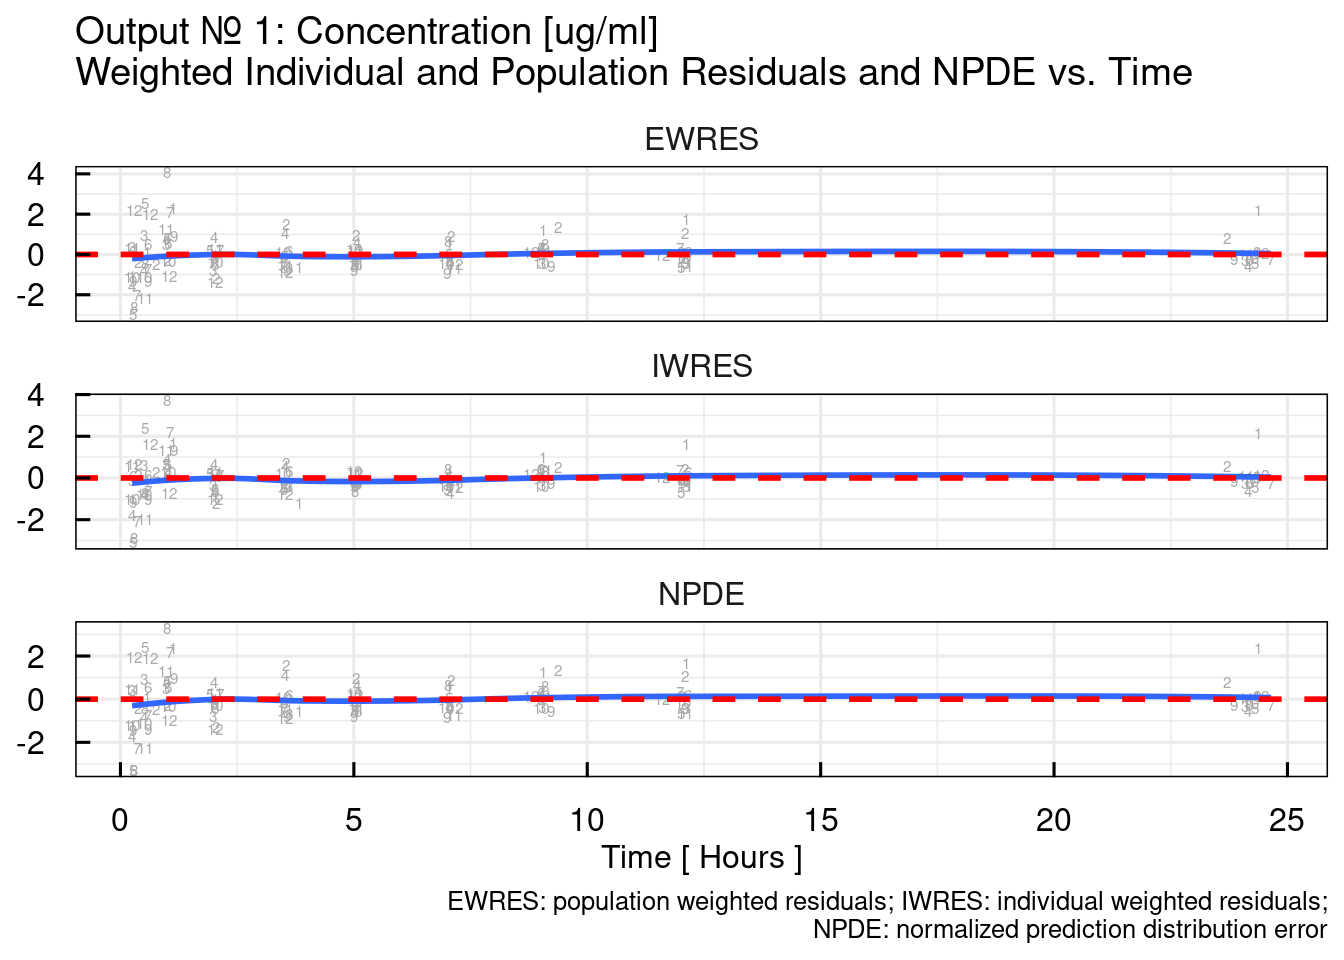
##
## $`RES/NPDE vs TIME log10`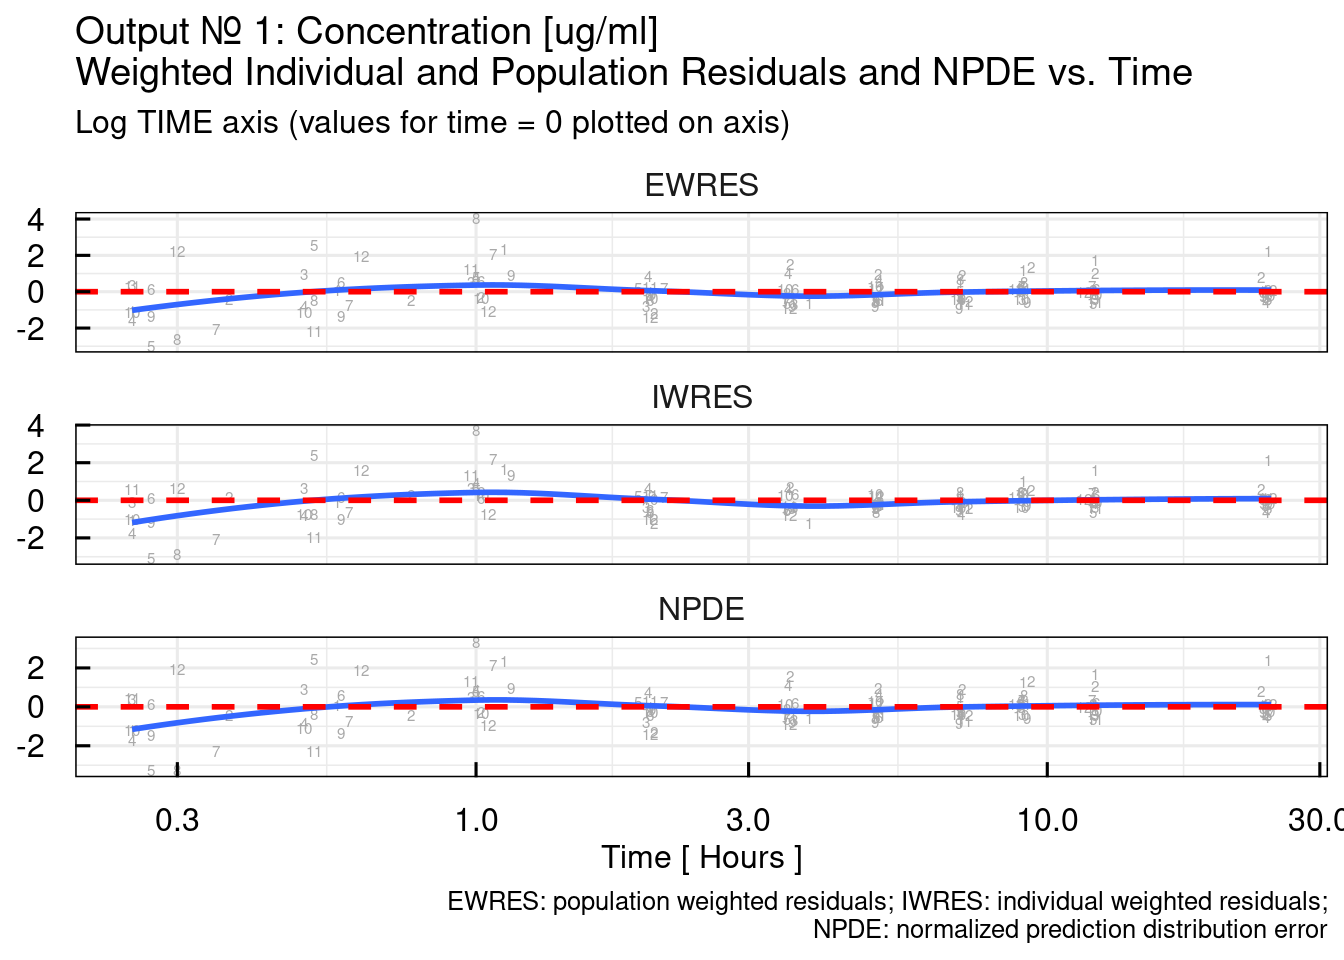
##
## $`RES/NPDE vs TAD`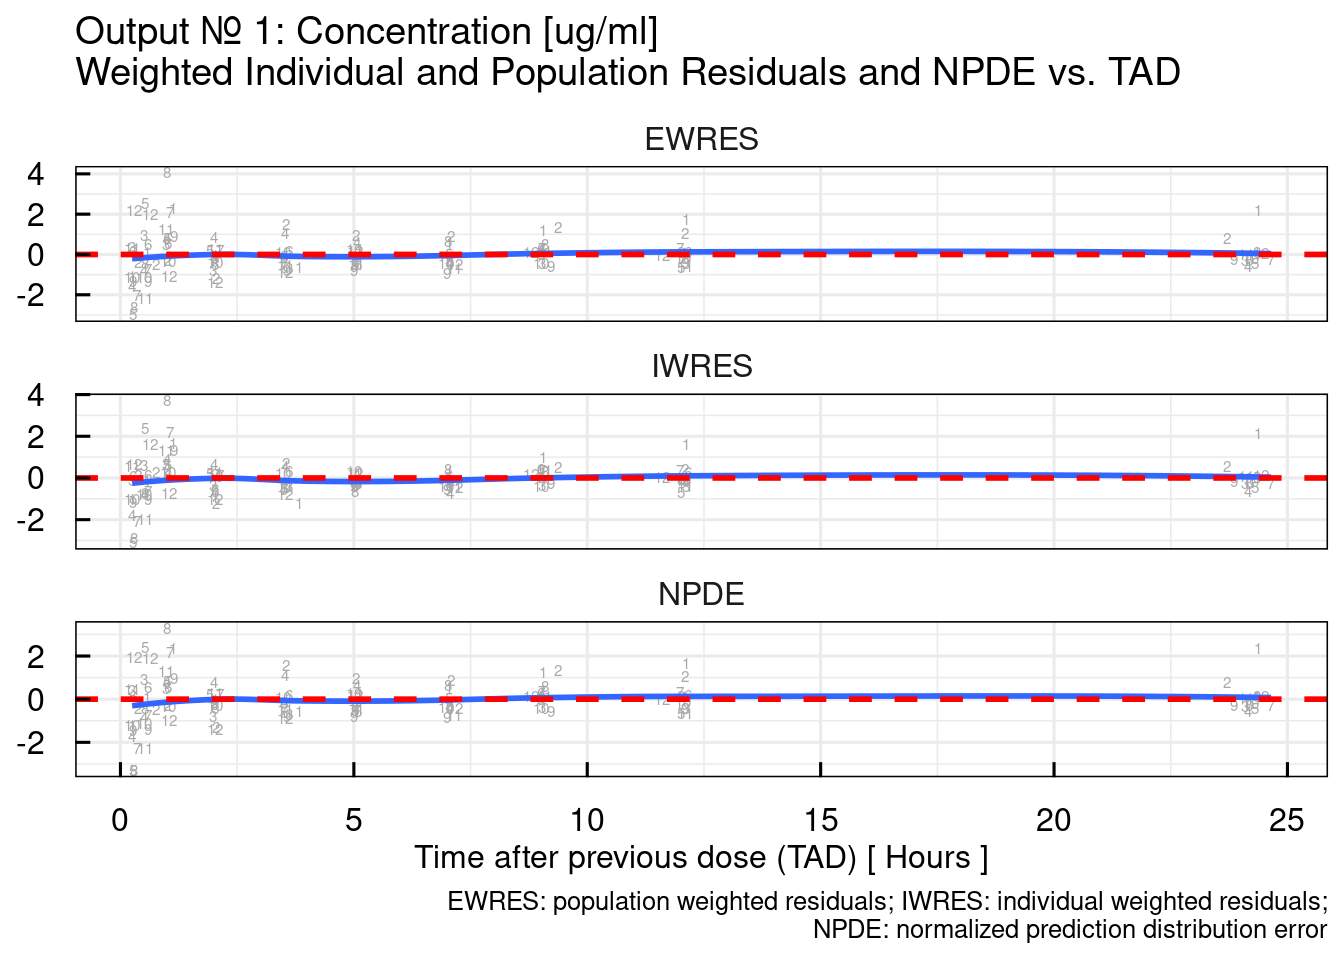
##
## $`RES/NPDE vs PRED linear`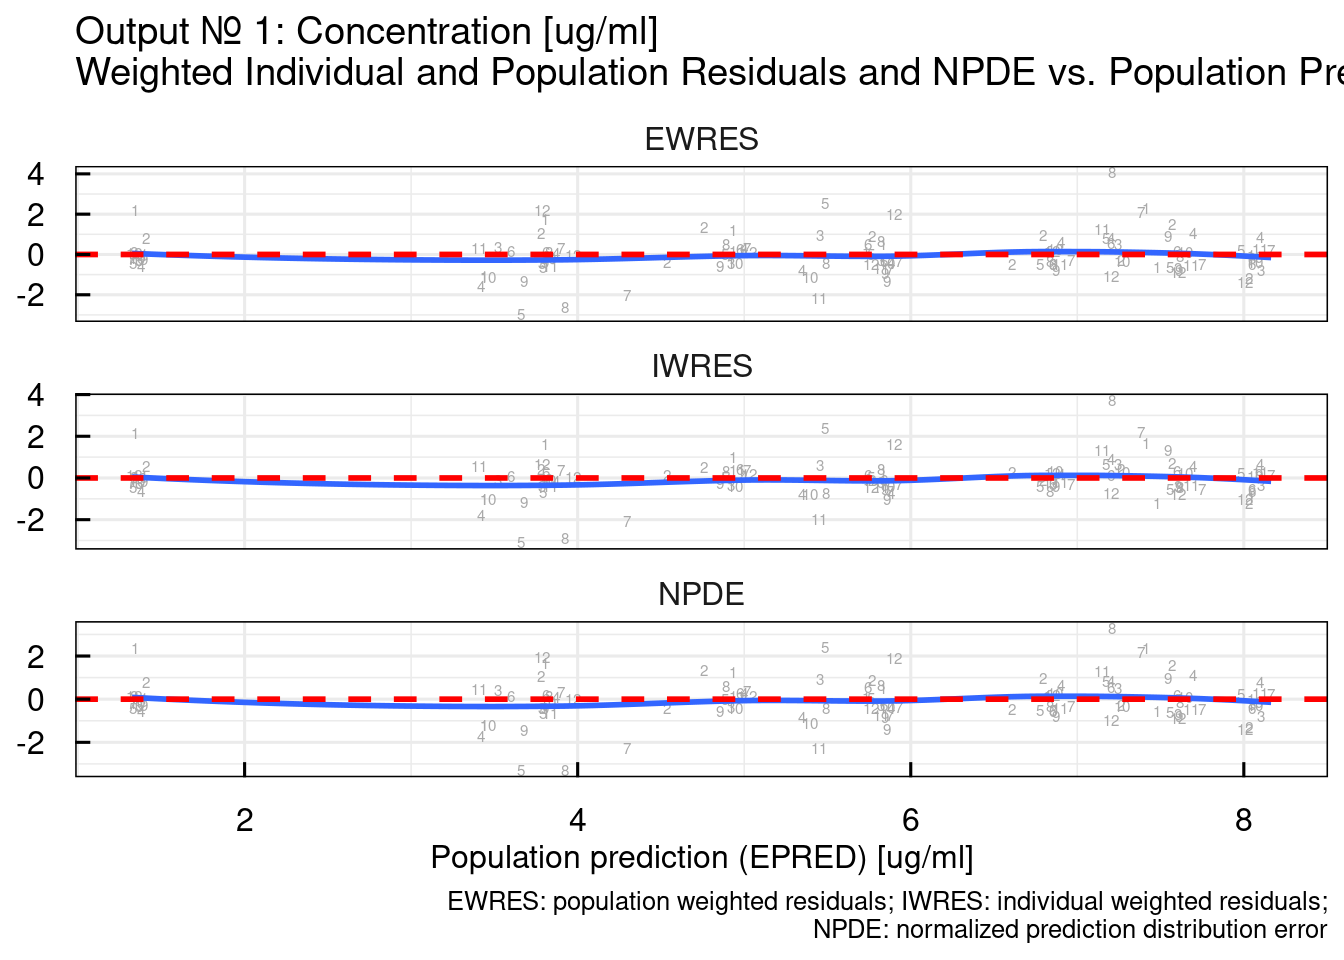
##
## $`RES/NPDE vs PRED log10`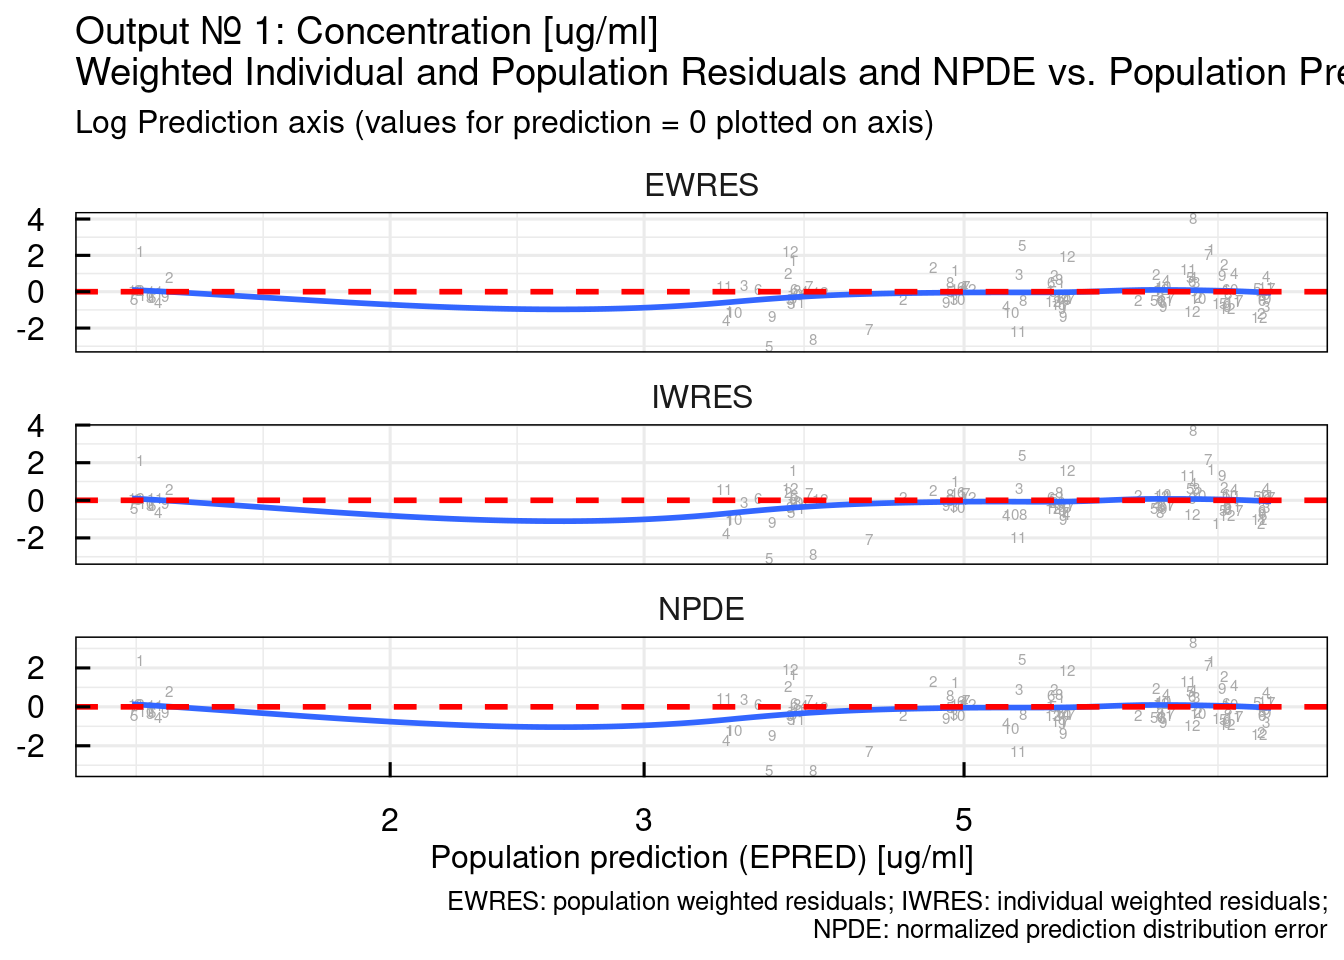
##
## $`IRES vs IPRED linear`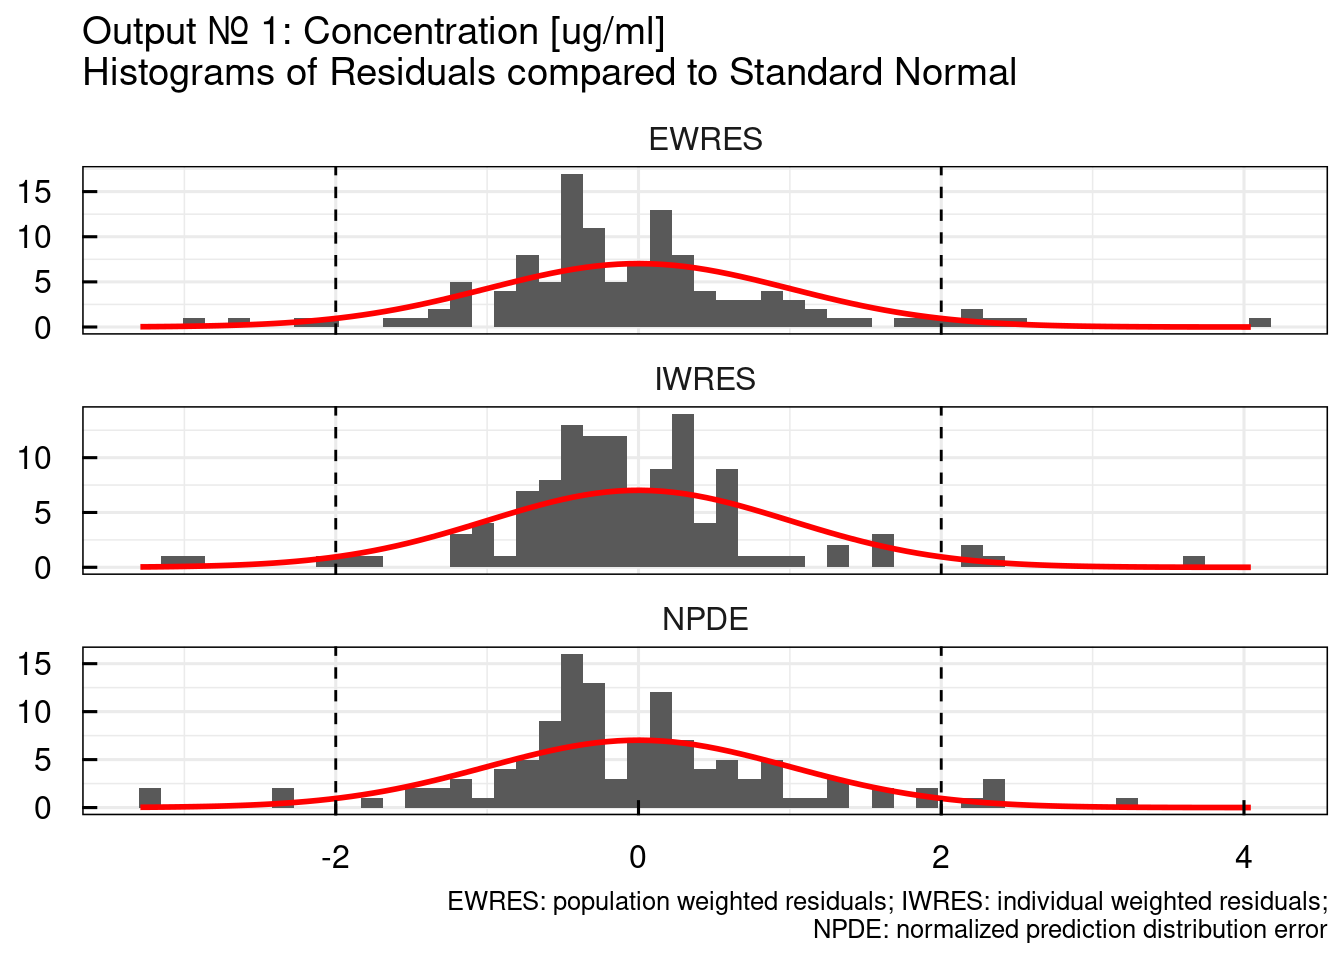
##
## $`IRES vs IPRED log10`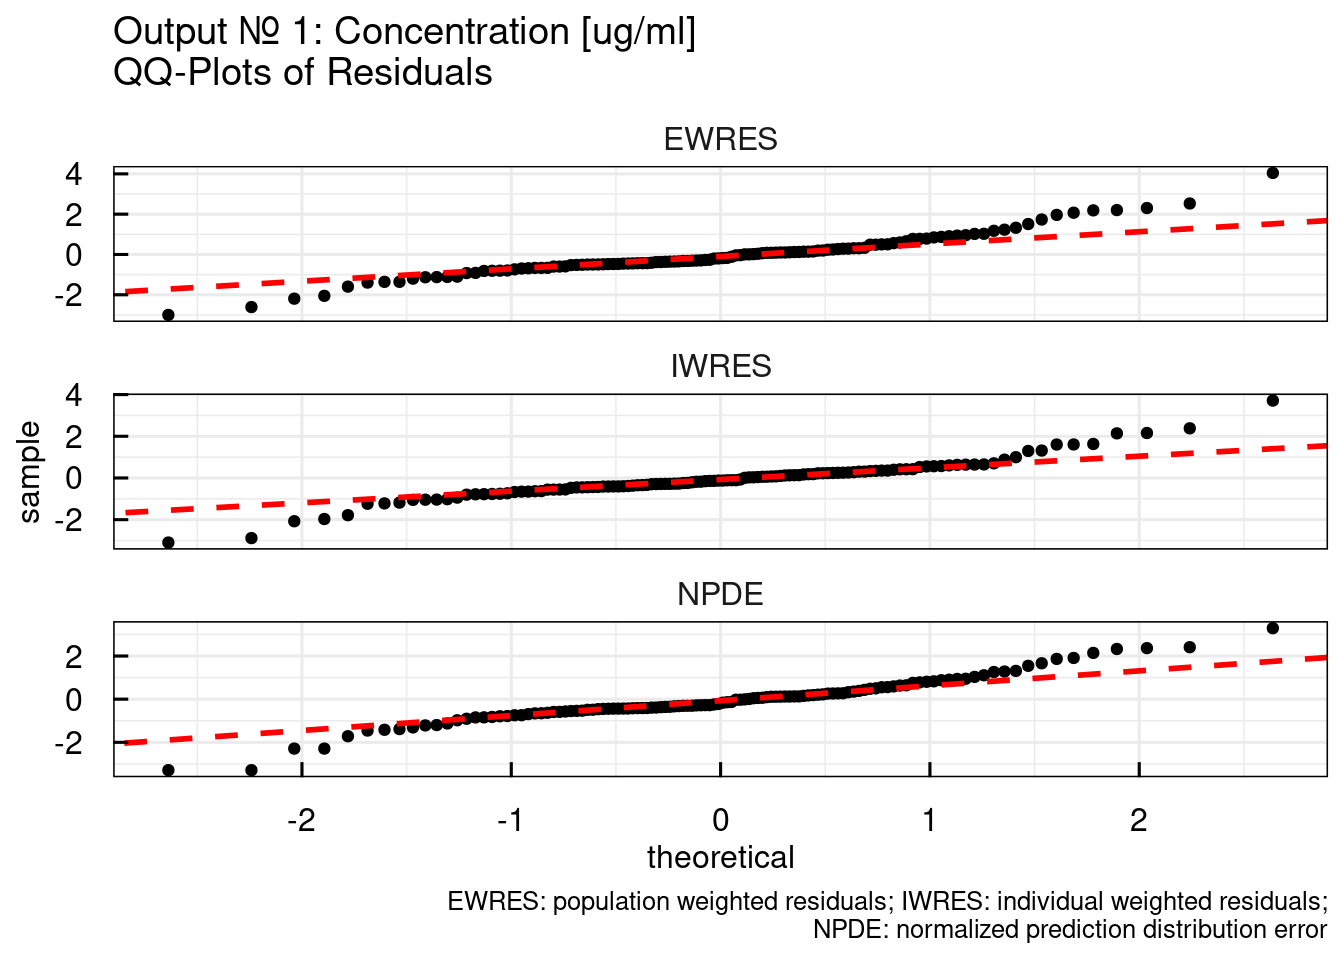
##
## $`RES/NPDE histograms`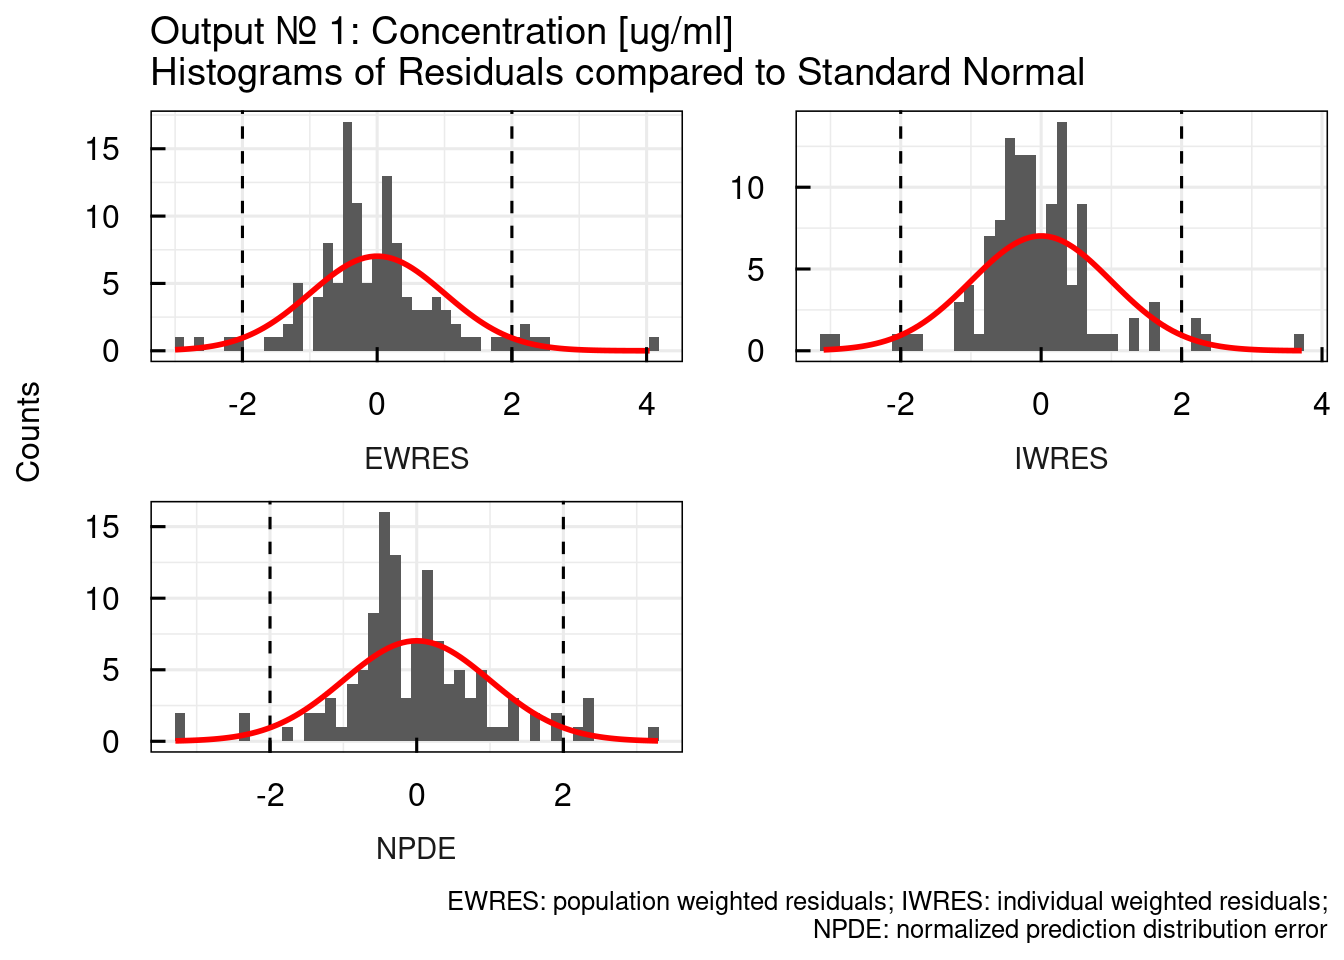
##
## $`RES/NPDE QQ plots`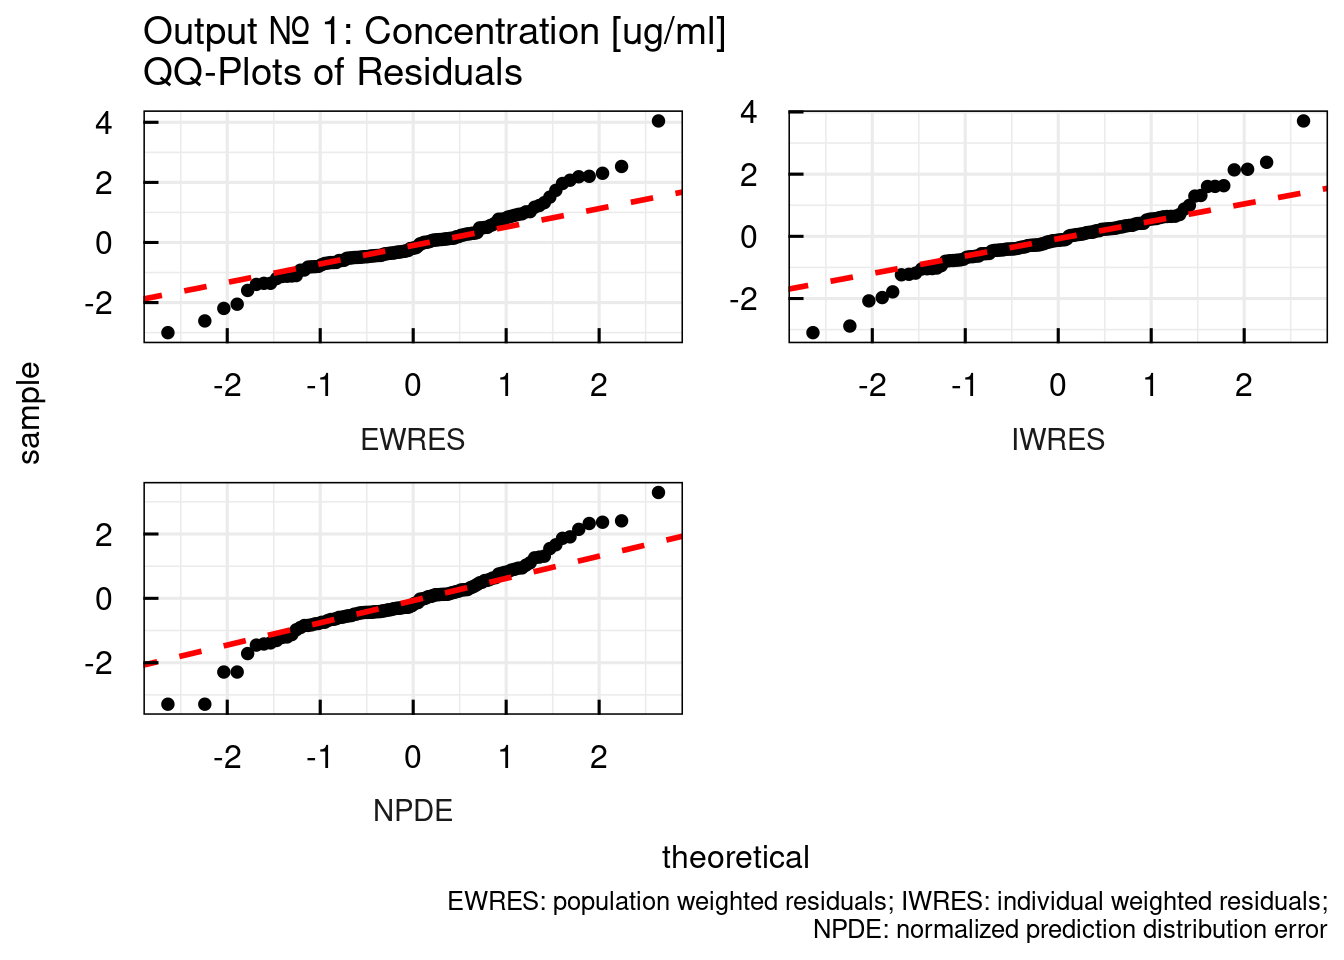
13.1.4 Individual plots
Individual plots showing DV, PRED, and IPRED can be generated as follows. Again the number of the output to generate them for can be provided.
13.2 VPC
Visual-predictive checks can be generated in IQR Tools in a straight forward manner, independently if the project is built based on NONMEM, MONOLIX, or NLMIXR. It works for all IQRnlmeProject objects. It can even be used if you work on a QSP model and have an IQRsysProject object.
In the following we will use one of the NLME projects generated in longitudinal NLME modeling as example model.
13.2.1 Generate VPC
A VPC is generated using the function vpc_IQRnlmeProject(). The only required input argument is the path to an IQRnlmeProject or IQRsysProject. In the following function call the following optional arguments are used:
Ntrials: defines the number of simulation replicates (here a small number is used so the book does not take too long to compile)- There are lots of additional options (e.g. prediction correction, etc.) have a look at the functions documentation!
That function does not plot the VPC but only prepares the simulation results to be plotted afterwards, using the plotVPC_IQRdataVPC() function.
Plotting of the VPC is done with the plotVPC_IQRdataVPC(). This function returns a list of objects - one for each output in the model.
13.2.2 Prediction corrected VPC (pcVPC)
pcVPCs can be generated using the FLAGpreparePC = TRUE argument in the vpc_IQRnlmeProject() function, and FLAGpc = TRUE in the plotVPC_IQRdataVPC() function.
13.2.3 VPC data
By default the modeling dataset is used to define the number of subjects, dosing times, etc. The user can, however, also provide an own dataset. Examples when this is useful:
- Dose normalized VPC across multiple dose-levels in case of linear model
- Single-dose VPC but modeling data contains in addition multiple dose data
- Steady-state VPC
- Adding additional stratification information
13.2.4 VPC sequential modeling
VPCs can also be generated for sequentially built longitudinal models, such as PKPD models. This can be done in several manners.
- If individual PK parameters are provided in a PKPD modeling dataset, these will be used by default (regressors).
- If the user desires that also for the PK model parameters should be sampled from the variability distribution (not using invididual PK parameters) then the argument
modelsSamplecan be used to define additional NLME projects from which to sample individual parameters for simulation. The parameter names need to exist in the structural model that was used for the model to generate the VPC for.
13.3 Bootstrap
The use of bootstrapping might be a little bit outdated, but if you used FOCEI in NONMEM it might be the only way to consistently obtain this information. And, of course, the EMA might request a bootstrap to be done in any case if you get a reviewer from a country in the North.
Non-parametric bootstrapping to assess parametric uncertainty for NLME and QSP projects can be done in IQR Tools in a straight forward manner, independently if the project is built based on NONMEM, MONOLIX, or NLMIXR. It works for all IQRnlmeProject objects. It can even be used if you work on a QSP model and have an IQRsysProject object.
In the following we will use one of the NLME projects generated in longitudinal NLME modeling as example model to be bootstrapped.
13.3.1 Generate bootstrap
A bootstrap is generated using the function bootstrap_IQRnlmeProject(). The only required input argument is the path to an IQRnlmeProject or IQRsysProject. In the following function call the following optional arguments are used:
bootstrapPath: defines the path where to generate the models and results outputNsamples: number of dataset replicates (here a small number is used so the book does not take too long to compile)Nparallel: number of models to run in parallelncores: number of cores per model rungroup: stratify the sampling of the dataset by the SEX column
13.3.2 Bootstrap results
Results of a bootstrap run are stored in the bootstrapPath folder. This folder contains all models and the following, bootstrap specific, output:
A table with the parameter estimates and their 95% confidence intervals from the original model and the median and 95% confidence interval from the bootstrap models:
##    Bootstrap results
##    ======================================================================================
##
##    Parameter  | Model estimate | Bootstrap median | Model 95% CI      | Bootstrap 95% CI
##    --------------------------------------------------------------------------------------
##    ka         | 0.08535        | 0.085            | [0.07552,0.09518] | [0.07605,0.09403]
##    CL         | 3.473          | 3.408            | [3.001,3.945]     | [3.042,3.984]
##    Vc         | 2.14           | 2.14             | [1.079,3.201]     | [1.55,2.951]
##    omega(ka)  | 0.02126        | 0.0265           | [-0.3247,0.3672]  | [0.01475,0.1367]
##    omega(CL)  | 0.1828         | 0.1862           | [0.02481,0.3409]  | [0.1345,0.2697]
##    omega(Vc)  | 0.5721         | 0.5555           | [0.2068,0.9375]   | [0.4122,0.8009]
##    error_ADD1 | 0.7513         | 0.7139           | [0.673,0.8295]    | [0.5645,0.8204]
##    --------------------------------------------------------------------------------------
## N=20 bootstrap samples were evaluable (objective function different from "NA").
## Number of significant digits: 4
##
## IQRoutputTable object
In this example this table file is available here.
In addition a PDF document is generated, containing histograms of the bootstrap derived parameters and information about median and 95% confidence intervals for the original and bootstrap models:
13.3.3 Stratification
The `group input argument can be a character vector, containing names of columns that are present in the dataset. When sampling new data (with replacement), the same number of subjects with defined properties is retained. In the above example, each sampled dataset will have as many females and males as the original dataset.
If group=c("SEX","STUDY") is used, then the sampled datasets will have the same number of females and males per study as in the original dataset, etc.
13.3.4 Large bootstraps
If very large bootstraps need to be conducted it might be beneficial to first generate all models, execute them outside IQR Tools, and then only postprocess the results in IQR Tools. For this purpose the bootstrap_IQRnlmeProject() function has the two optional arguments FLAGgenerateModelsOnly, and FLAGanalysisOnly.